Finding the leading ai server companies requires more than comparing processor speeds or glossy product pages. A serious evaluation examines the complete system: GPUs, CPUs, memory bandwidth, networking, cooling, software support, security, and service coverage. A server may look powerful in a showroom, yet perform poorly when thousands of models run continuously. Rack density matters. So does the time needed to replace a failed component.
Jensen Huang, NVIDIA’s founder and CEO, once said, “The more you buy, the more you save.” His comment reflects the economics of accelerated computing, where purchasing scale can reduce costs through volume, optimized software, and shared infrastructure. However, price alone cannot identify the leading ai server companies. Buyers should study independent benchmarks, published customer results, warranty terms, energy consumption, and deployment records. A data center manager may value predictable maintenance more than a small performance gain. That detail is easy to overlook.
This guide will compare major vendors through practical evidence, not marketing language. It will consider companies building complete AI platforms, specialized systems, and configurable servers for research, cloud, and enterprise workloads. The comparison will also examine supply-chain resilience and technical support. No ranking is perfect. Real performance changes with workload, model size, cooling design, and software versions. That uncertainty deserves attention. A useful decision should remain credible after the server leaves the brochure and enters a noisy, demanding data center.
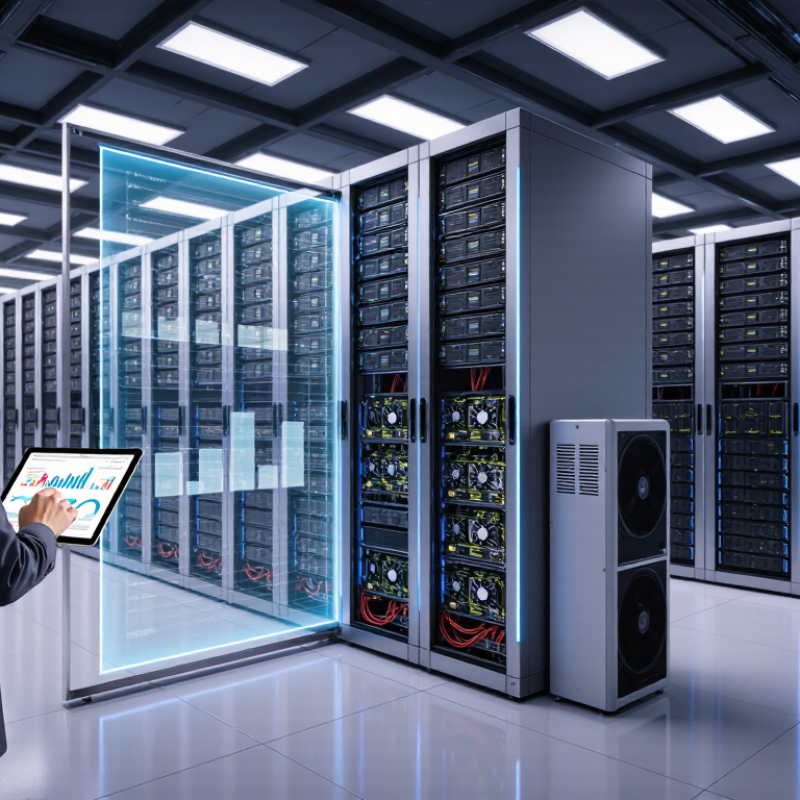
Define AI Server Leadership Across GPUs, CPUs, Memory, and Networking
AI server leadership is not a GPU-count contest.
Compare complete systems under the same workload, model, and power limit.
Gartner estimated AI semiconductor revenue at $71 billion in 2024, up 33% from 2023.
That growth makes accelerator performance important, but peak specifications alone can mislead. Measure useful tokens per second, GPU utilization, and performance per watt. Then check whether the CPU can feed the accelerators without creating bottlenecks.
Memory and networking decide how well that compute works at scale.
Record high-bandwidth memory capacity and bandwidth, plus how performance changes when a model exceeds local memory. Look for the effects of data movement: a rack may have fast GPUs yet spend time waiting for data. Test network bandwidth, latency, and congestion across multiple servers, not just one.
IDC projected global AI spending would reach $632 billion by 2028, reflecting demand across systems and services.
No scorecard is perfect. A practical comparison should also report cooling needs, reliability, and results on repeatable workloads. I would question any ranking that hides power draw or tests only its strongest configuration.
Measure Market Scale Against IDC’s $154 Billion 2024 AI Infrastructure Forecast
IDC’s $154 billion forecast for 2024 AI infrastructure spending offers a useful scale check. It is not a ranking of server makers. The figure covers a wider infrastructure market, so comparing it directly with one company’s server revenue can mislead. Check each company’s reported AI-server sales, shipment volumes, and share of total revenue. Look for consistent definitions across reporting periods. A supplier with rising sales but limited production capacity may not benefit equally from market growth. Small distinctions matter.
Power and cooling also shape the comparison. The International Energy Agency reported that data centres used about 460 terawatt-hours of electricity in 2022, and projected consumption could exceed 1,000 terawatt-hours by 2026. That estimate covers data centres broadly, not AI servers alone. Still, it highlights a practical constraint: equipment must fit within real facility power limits. Compare companies’ delivery capacity, system configurations, and customer concentration alongside market share. This comparison is imperfect. Public disclosures vary, and some estimates blend AI servers with other accelerated computing systems. Treat the numbers as evidence, not certainty.
How to Find the Leading AI Server Companies? - Measure Market Scale Against IDC’s $154 Billion 2024 AI Infrastructure Forecast
| Metric |
Figure or benchmark |
How to use it when assessing AI server market leaders |
| Worldwide AI infrastructure spending, 2024 |
US$154 billion (IDC forecast) |
Use as the overall market-scale reference. It covers AI infrastructure, not server companies’ revenue alone. |
| Year-over-year market growth, 2024 |
97% (IDC forecast) |
A fast-growing market can lift multiple suppliers; growth alone does not establish company market share or leadership. |
| Implied worldwide AI infrastructure spending, 2023 |
Approximately US$78.2 billion (calculated estimate) |
Calculated as US$154 billion ÷ 1.97. This is an estimate derived from IDC’s rounded 2024 forecast and growth rate, not a separately quoted figure. |
| AI server / compute infrastructure |
Part of the infrastructure market; a separate dollar amount is not stated in the headline forecast. |
Compare disclosed AI server revenue, system shipments, and order backlog; do not treat the full US$154 billion as server revenue. |
| Storage and networking infrastructure |
Related infrastructure categories; individual values are not provided by the headline forecast. |
Keep these categories separate from server sales when comparing supplier scale to avoid overstating addressable server revenue. |
| Company-level market share |
Not supplied by the aggregate forecast |
Calculate only from comparable company-level AI server revenue or shipment data for the same period and market definition. |
| Suggested leadership checks |
AI server revenue; units shipped; production capacity; backlog; customer deployments |
Use consistently defined, dated disclosures. The IDC market forecast provides context, not a company ranking. |
Source: IDC’s 2024 worldwide AI infrastructure spending forecast. The implied 2023 figure is calculated from the forecast’s stated 2024 amount and year-over-year growth rate; it is approximate.
Compare Vendor Revenue Using NVIDIA’s $47.5 Billion FY2024 Data Center Sales
A useful benchmark is the $47.5 billion in data center sales reported by a leading accelerator supplier for fiscal 2024. Treat it as market context, not as revenue earned by AI server companies. The figure covers a broad data center business, while server vendors may report hardware, services, or entire systems. Those categories do not line up neatly. A large number can look decisive, but it may answer the wrong question.
When comparing server companies, check each firm’s fiscal year, reporting currency, and revenue definition. Separate AI server sales from general-purpose servers, networking, and support services where disclosures allow. Look for shipment volumes, customer concentration, and evidence that systems reached production. Audited filings and investor reports are stronger evidence than estimates repeated across websites. Still, disclosures can be incomplete. That makes precise rankings harder than they appear.
Tips: Build a simple table with reported AI-server revenue, period, and source. Mark estimates clearly. Compare like with like. If a vendor combines server and infrastructure revenue, don’t treat the total as AI server sales. One limitation remains: public reporting rarely isolates every AI system cleanly. A careful comparison may be less tidy, but it is more trustworthy.
Evaluate Performance with MLPerf Training and Inference Benchmark Results
Finding leading AI server companies requires more than counting accelerators. MLPerf offers a useful, repeatable starting point. Its Training results show how quickly a system completes defined model-training tasks, while Inference results measure serving performance under specific scenarios. Check the benchmark version, workload, software stack, and system configuration before comparing scores. Without those details, a result is hard to interpret. Small print matters.
For a practical review, compare the same benchmark version and scenario, then examine training time, throughput, and latency. A server with high throughput may still respond poorly under strict latency targets or changing request loads. Look at scaling across accelerator counts and reported power use; these details can reveal efficiency, not just peak speed. Ask how closely the tested configuration matches your planned deployment, including memory capacity, networking, and cooling. That part is easy to overlook. MLPerf is not a complete buying guide, and published runs cannot predict every workload. I would keep one reservation: benchmark reports can make messy operational realities look tidy. Still, reproducible results give teams concrete evidence to discuss when evaluating systems.
How to Find the Leading AI Server Companies? — Evaluate Performance with MLPerf Training and Inference Benchmark Results
MLPerf Inference v4.1 workload coverage by task family. Counts are derived from the nine workloads in the benchmark suite; they show evaluation breadth, not server performance scores.
To compare systems, review official MLPerf results for the same workload and scenario, then consider both throughput and latency alongside the reported accuracy requirements. This chart contains no company or brand results.
Rank Total Cost, Energy Efficiency, Supply Capacity, and Enterprise Support
To rank AI server suppliers, compare total cost of ownership across a fixed three-to-five-year workload, not purchase price alone.
Include accelerators, networking, rack power, cooling, software, maintenance, and the cost of idle capacity. The International Energy Agency’s Electricity 2024 report projects data-centre electricity consumption could exceed 1,000 TWh in 2026. That matters. Uptime Institute’s 2024 Global Data Center Survey reports an average facility PUE of 1.56. Treat PUE as a facility-level indicator, not a direct measure of server efficiency. Request benchmark results for your model sizes, utilization, and cooling conditions; peak figures can mislead. Compare annual energy bills under local tariffs, including peak-demand charges.
Supply capacity deserves evidence, not assurances.
Ask each supplier for recent on-time delivery rates, confirmed quarterly allocations, lead times, and replacement-part stock by region. Test those claims with a pilot shipment; promised volume is not a delivered rack. Score enterprise support using response times, escalation access, firmware coverage, spare parts, and onsite repair windows. Request service data for comparable deployments, and check how exclusions apply during outages. A low-cost system can become expensive if a failed accelerator sits unused for days. I would still question any single composite score: weights reflect your workload, and real utilization often disappoints. Run a sensitivity check.
Conclusion
Finding the leading ai server companies requires a balanced evaluation of the entire infrastructure stack, not just processor speed. A strong assessment should consider GPU and CPU capabilities, memory bandwidth, networking performance, system scalability, and software compatibility. Market scale can be compared with the projected $154 billion global AI infrastructure opportunity for 2024, while vendor revenue provides another indication of commercial strength and adoption.
Performance should be measured through transparent MLPerf training and inference results, including speed, latency, throughput, and workload consistency. However, the best provider is not always the fastest. Total cost of ownership, energy efficiency, supply capacity, deployment flexibility, warranty coverage, and enterprise support are equally important. By combining financial scale, benchmark evidence, operational reliability, and long-term service quality, buyers can identify AI server companies that deliver sustainable value for research, cloud, and enterprise workloads.
 Cloudion